Financial Market Performance & Risk Analysis

Overview
This project analyzes historical equity market data to evaluate long-term market performance, company-level returns, and risk-adjusted investment outcomes.
An end-to-end analytics pipeline was built using Azure SQL for data modeling and Power BI for visualization.
The analysis focuses on understanding how market growth evolved over time and whether company performance justified the level of risk taken.
Business Problem
Investors often evaluate performance based only on returns, ignoring risk exposure and market timing.
The objective of this analysis was to:
Measure true investment growth using compounded returns
Identify companies driving market performance
Evaluate performance relative to volatility
Understand when major market shifts occurred
Approach
The solution was designed using a layered analytics architecture:
Raw market data ingested into Azure SQL
Warehouse-style modeling using fact and dimension tables
Daily financial metrics calculated using SQL window functions
Returns aggregated using compounding methodology
Interactive dashboards built in Power BI
Analysis Performed
Key analytical components included:
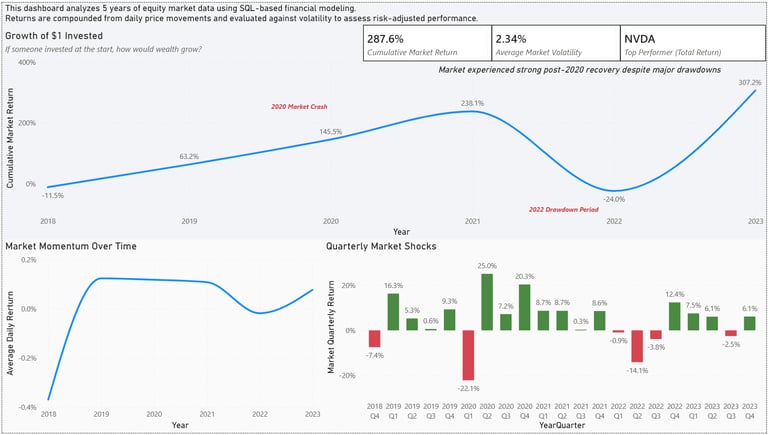
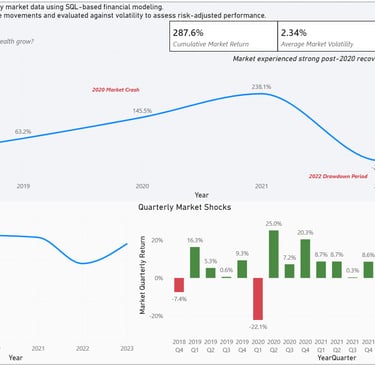
Market cumulative performance tracking
Quarterly performance segmentation
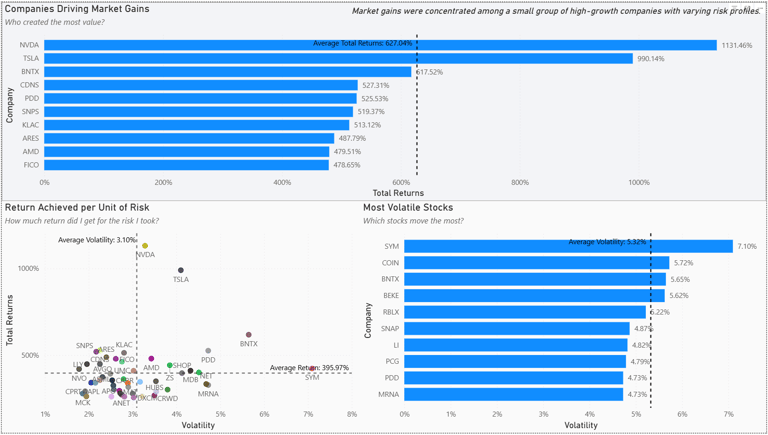
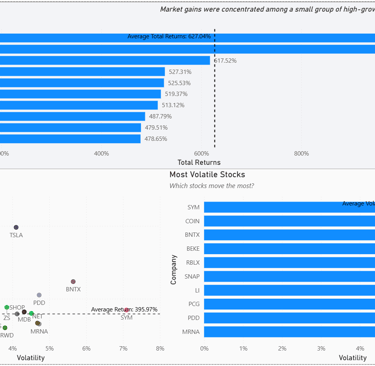
Company return ranking
Volatility measurement
Risk vs Return comparison
Financial returns were compounded rather than summed to accurately reflect investment growth.
Key Insights
Market growth followed cyclical recovery phases rather than steady expansion.
Performance gains were concentrated among a subset of companies.
Higher volatility did not consistently translate into higher returns.
Several companies showed inefficient risk profiles despite large price movements.
Tools & Technologies
Azure SQL Database
T-SQL
Power BI
DAX
Data Modeling & Financial Analytics